The Octopus Management Console records and logs all actions completed or attempted by users and other system components (e.g., servers). You can use these records for troubleshooting, auditing, and fulfilling regulatory requirements.
To view the list of auditing events, select Auditing from the menu bar. By default, all recorded events are listed. You can filter the list according to event severity, source, session ID and more, as described in the sections below.
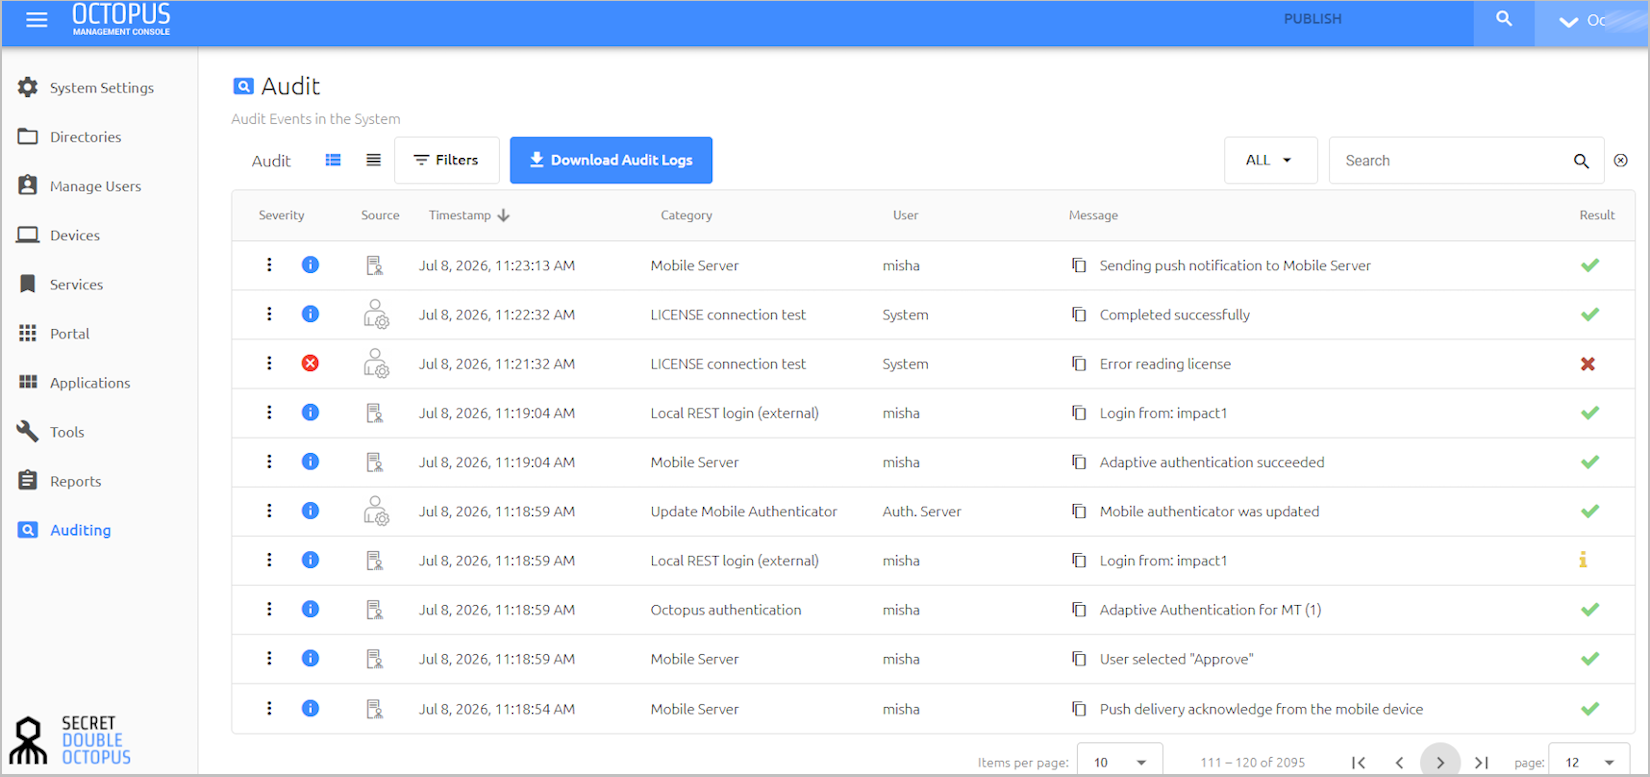
The grid on the Auditing page provides the following information about each event:
Column | Description / Notes |
|---|---|
Severity | The extent to which the event affects normal system functioning. For details, refer to Understanding Severity, Sources and Results of Events (below). |
Source | The system component or element where the event took place. For more information, refer to Understanding Severity, Sources and Results of Events (below). |
Timestamp | Date and time of event occurrence. |
Category | Type of event. |
User | Name or username of the entity performing the event. |
Message | A brief summary of the event. You can view additional data by clicking the icon in the Severity column (Viewing Event Details). |
Result | Icons indicating the status of the event. For details, refer to Understanding Severity, Sources and Results of Events (below). |
Event severity reflects the degree of impact (or potential impact) of the event on normal system operation and end user experience. The severity levels are:
 Critical: Events that interfere with system functioning, such as LDAP service errors, system component connectivity issues, etc.
 Warning: Events that interfere with management and administrative operations (e.g., unsuccessful Admin login to the Management Console).
 Info: Events involving routine flows, actions and operations.
IMPORTANT: All events related to user authentication have a severity level of Info, regardless of whether authentication succeeded.
The source is the system component that generated the event or that served as the event venue. Possible sources are:
Icon | Source Name | Description | Sample Event |
|---|---|---|---|
| Active Directory Service | The service responsible for communicating with the Octopus Remote AD Agent to synchronize the Remote AD directory with the on-premise AD | Directory sync |
| Authentication Server | The component responsible for processing authentication requests | Push delivery acknowledgment received from mobile device |
| Management Console | The component responsible for administration and management of the product | Admin user logged in |
| Octopus Mobile App | The Octopus Authenticator mobile application To receive events from this source, the Enable Remote Audit toggle in the Octopus Authenticator settings (System Settings > Authenticators) needs to be enabled. | Authentication request approved by user |
| Portal Server | The component responsible for user enrollment, access to supported web applications, and user self-service actions | Sending login request to Authentication Server |
| FIDO Server | The component responsible for processing FIDO-specific authentication requests | Logged in from FIDO Server |


IMPORTANT: Source icons are displayed for events generated after installing or upgrading to Octopus Authentication Server version 6.4 and higher.
The icons in the Result column show the event's status. Possible results include:
Icon | Status | Event Description |
|---|---|---|
| Succeeded | Events that were executed and completed as expected. |
| Failed | Events involving unsuccessful authentication, system errors, and system performance or connection issues. |
| Challenged | Login events involving the Adaptive Authentication flow. |
| Bypassed | Login events involving authentication with username + password. This result is relevant only for events related to the ADPA service. |
| Deferred | Login events in which the authentication push request is not received by the mobile app, and the Authentication Server then defers to the Octopus Agent to allow or prevent offline (e.g., BLE) authentication. Deferred events generally occur in scenarios involving insufficient mobile network coverage. |


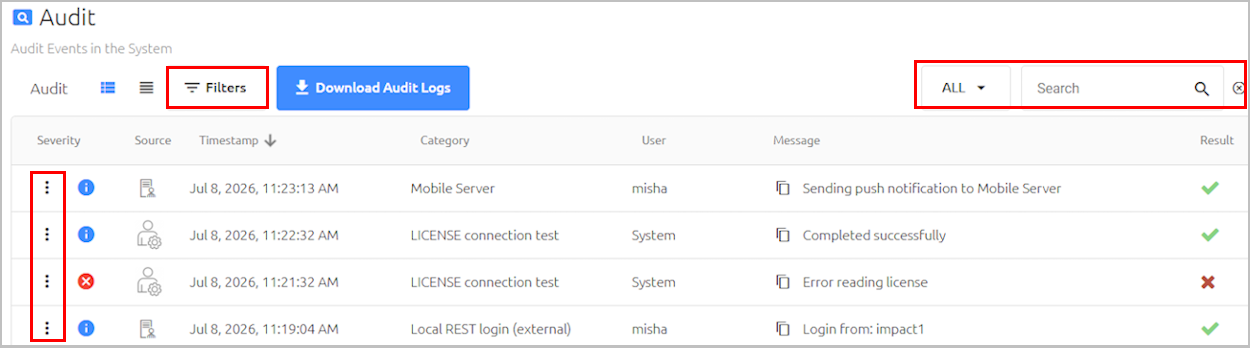
The filtering features at the top of the Auditing menu enable you to filter displayed events according to session ID, severity, source, result, timeframe and/or a specific search term, such as a user. Multiple filtering methods can be used simultaneously.
Filtering by Session ID
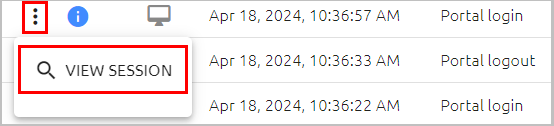
The View Session feature allows you to quickly filter the Auditing list for all events related to a specific authentication session. In the row of a relevant event, click  and then select View Session.
The Auditing list immediately displays only events that share the same Session ID as the selected event. The following example shows the complete sequence of events involved in authentication to the User Portal via the Octopus Authenticator mobile app.
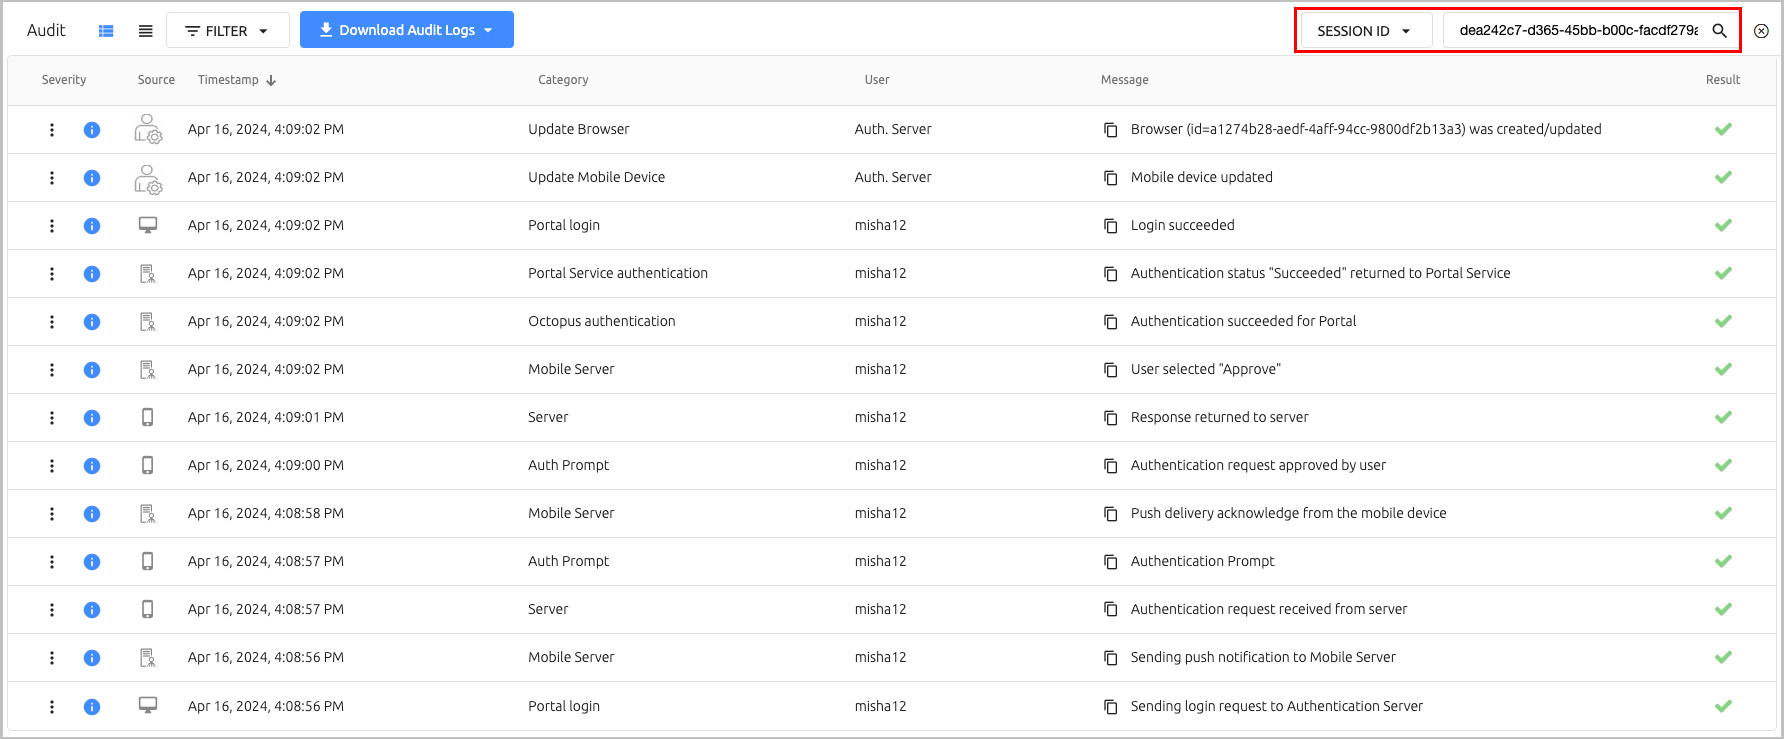
IMPORTANT: The View Session feature is relevant only for events generated after installing or upgrading to Octopus Authentication Server version 6.4 and higher.
Filtering by Event Severity, Source, Result and Time Range
The Advanced Filters feature supports multi-factor filtering, including combinations of different severity levels, sources and results. In addition, a specific time range can be defined.
To use the Advanced Filters feature:
At the top of the Audit page, click Filter.
The Filters dialog opens.
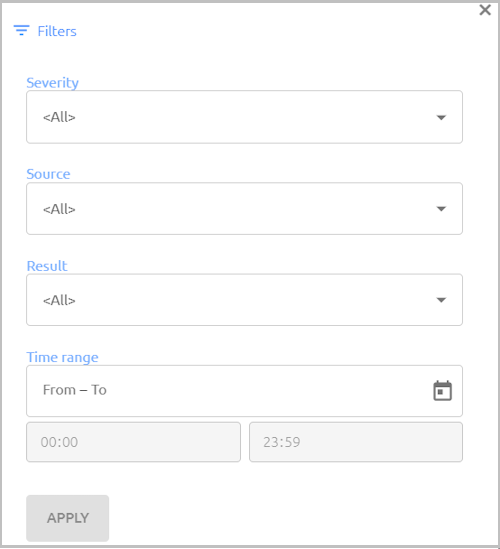
Open each list and select the checkboxes of the required severities, sources and results. Note that only elements and components included in the current Auditing list are displayed as selection options. For example, if there are no events in the list whose source is the mobile app, Octopus Mobile App will not appear in the Advanced Search Source list.
Note: To receive events from the Mobile App, verify that the Enable Remote Audit toggle in the Octopus Authenticator settings (System Settings > Authenticators) is enabled.Under Time range, specify the start and end dates by selecting them from the date picker popup. Then specify the start and end times.
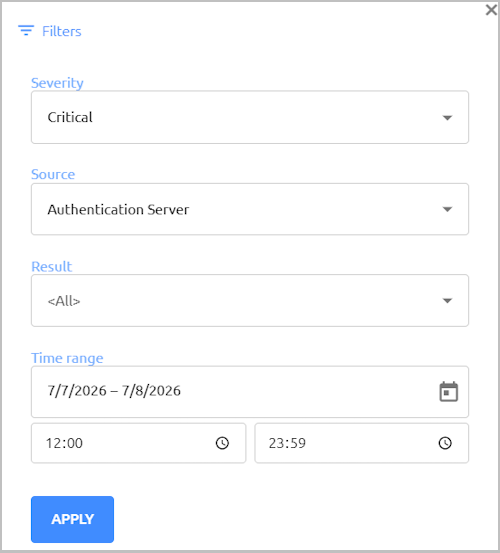
Click Apply.
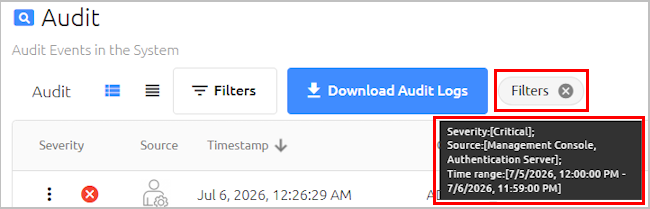
The Audit list is filtered according to your selections. To view the current filters, hover over the filtering chip to display the tooltip. For example:
Searching for Event Attributes and Keywords
The Search tool in the upper right corner of the Audit list lets you filter the list according to a free text keyword. Enter the keyword in the Search term field, and then click the Search icon or press <Enter>.
To narrow the scope of your search, you can select an attribute from the list to the left of the Search tool before performing your keyword search. You may select any ONE attribute. After selecting the attribute, enter a relevant term in the Search field (such as a username, etc.), and then press <Enter>.
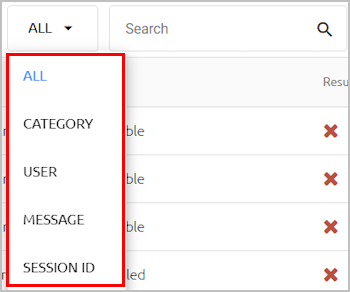
To quickly undo keyword filtering, click the Clear Search icon to the right of the Search field. (Any advanced filtering will be maintained.)

To view more detailed data about an event, click the icon in the Severity column, in the row of the relevant event. Additional information about the event appears in a popup. The event code, unique session ID, data about the device used for authentication (if relevant) and other attributes are provided for each event, to help track and debug authentication sessions.
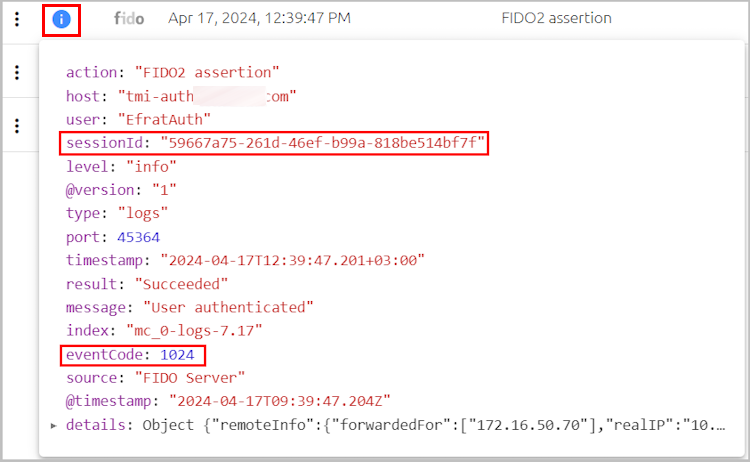
To close the popup, click the icon again.
Downloading Auditing Events
To download auditing events in CSV format, click Download Audit Logs (at the top of the Audit page). All events matching currently applied filters and attributes are included in the download.
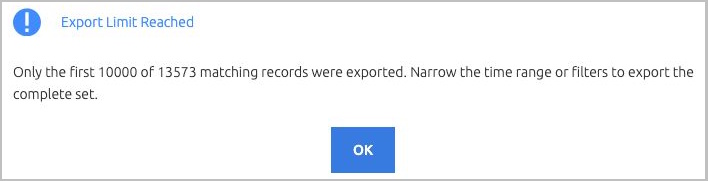
If the number of matching events exceeds 10,000, the Export Limit Reached popup appears. This popup shows the actual number of matching records and a prompt to narrow the selected time range / filters.